About the Author

A technical whitepaper for organizations who live in Dynamics 365 and want to modernize how they work with their data.
Executive Summary
Microsoft Fabric is a unified, software-as-a-service (SaaS) data analytics platform that consolidates data storage, data engineering, data integration, data warehousing, real-time analytics, data science, and business intelligence into a single product with one commercial and governance model. For the Dynamics 365 (D365) professional, Fabric is significant because it removes the friction between operational data locked inside D365 and the analytical work — reporting, forecasting, cross-system analysis — that business users perform every day.
This paper is written for a reader who is fluent in Excel (maybe some Power BI) and the day-to-day of Dynamics 365 Business Central (BC), Dynamics 365 Finance & Operations (F&O), or Customer Engagement (CE), but who is not a data engineer. Every concept is grounded in tasks a D365 power user already performs, then extended with the architectural detail needed to evaluate, scope, and defend a first Fabric project.
The core argument is simple: the tasks you already do — exporting D365 data to Excel, cleaning it with Power Query, and building Power BI datasets — each map directly onto a first-class Fabric capability. Fabric lets you do those tasks once, in a governed and shared way, instead of repeatedly and in isolation.
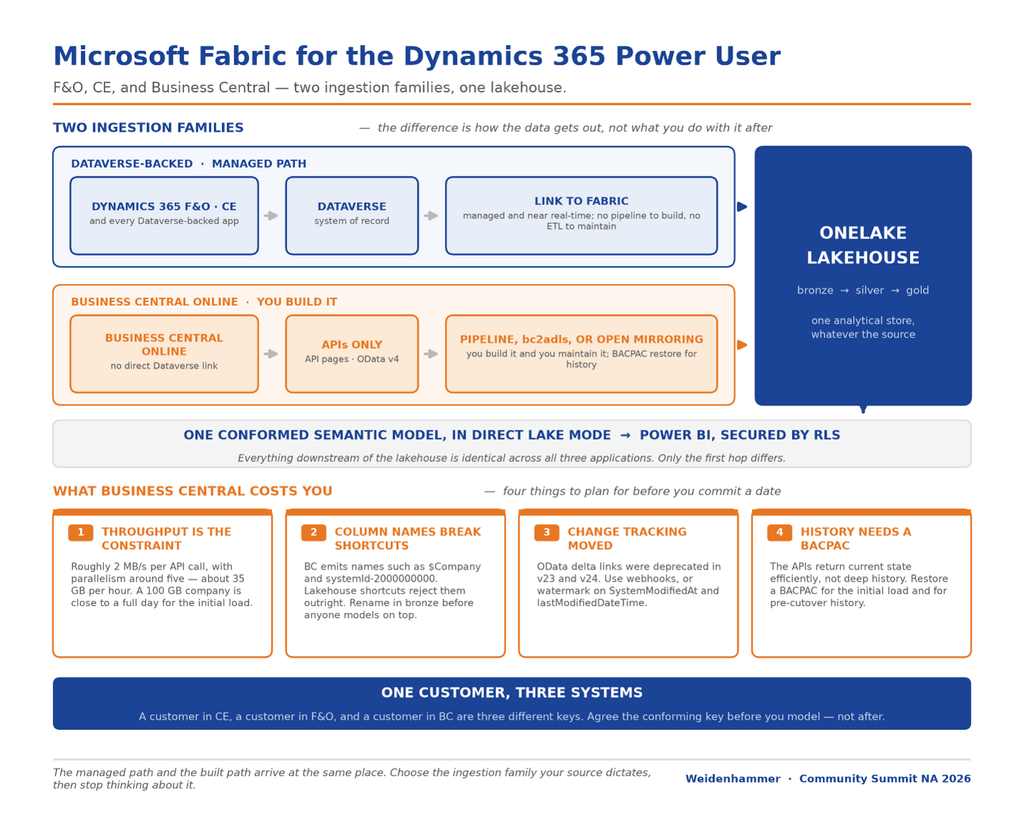
One caveat governs the whole paper and is worth stating at the outset: the Dynamics 365 family does not have a single ingestion story. Customer Engagement and Finance & Operations (with Power Platform Integration turned on) both surface through Microsoft Dataverse and therefore share a no-ETL, no-copy path into OneLake. Business Central does not run on Dataverse; it has its own tenant database and reaches Fabric through APIs, community tooling, or mirroring. Everything downstream of ingestion — storage, modeling, Direct Lake, security, licensing, and governance — is identical across all three. Only the first hop differs, and this paper treats that hop as two distinct families rather than one.
1. Introduction: the D365 data problem
Dynamics 365 is a system of record. It is optimized for transactions — creating a sales order, posting a journal entry, updating a customer record — not for analytics across millions of rows or across multiple systems. This design is correct for an ERP/CRM, but it creates recurring pain for the business users who need visibility into that data:

Repeated manual exports. Analysts export the same D365 entities to Excel every week or month, re-applying the same transformations by hand.

Fragile spreadsheets. Reports break when a workbook is renamed, a column is moved, or a formula is overwritten.

Scattered copies. The “same” data lives in dozens of Excel spreadsheets, network drives, and personal Power BI files, each subtly different and none authoritative.

No history. D365 retains current state; it is not designed (without extensions or customizations) to preserve the daily or monthly snapshots needed for trend analysis.

Siloed systems. Combining BC / F&O financials with CE opportunities, or with an external budget file, means manual joins that are error-prone and unrepeatable.
Microsoft Fabric addresses each of these directly. The rest of this paper explains how.
2. What Microsoft Fabric is
Fabric is best understood as one unified platform with many workloads sharing a single data lake. Rather than stitching together separate products (a storage account, a Spark cluster, a warehouse, an integration tool, and a BI service), Fabric presents these as integrated experiences over a common foundation called OneLake.
Key characteristics:
- SaaS, not IaaS/PaaS. Microsoft operates the infrastructure. There are no servers, clusters, or virtual machines for you to provision, patch, or scale manually. You buy capacity; Microsoft runs everything else.
- Built on the Power BI foundation. Fabric is the evolution of the Power BI service. The workspace concept, the tenant, the security model, and the semantic model engine are all extensions of technology Power BI users already know.

- Open data format. Data in a Fabric lakehouse is stored as Delta-Parquet — an open, columnar format. Your data is not trapped in a proprietary silo; any Delta-compatible engine can read it.
- One copy of data, many engines. A table written by a dataflow can be queried by SQL, read by a Power BI report, and processed by a Python notebook — without copying or moving it.
2.1 The Main Workloads at a Glance
| Workload | What it does | Closest thing a D365 user already knows |
| Data Factory | Pipelines and dataflows to ingest and transform data | Power Query, scheduled Excel refreshes |
| Data Engineering | Lakehouses and Spark notebooks for large-scale processing | (New) advanced transformation and automation |
| Data Warehouse | A full SQL warehouse for structured, reporting-ready data | A governed SQL database behind reports |
| Real-Time Intelligence | Streaming and event data analysis | (New) live operational monitoring |
| Data Science | Machine learning model training and scoring | (New) forecasting and prediction |
| Power BI | Semantic models, reports, and dashboards | Power BI — unchanged and central |
A D365 power user will spend most of her/his time in Data Factory (getting data in), the Lakehouse/Warehouse (where it lands), and Power BI (consuming it). The other workloads become relevant as needs mature.
2.2 How Fabric differs from Azure Synapse and standalone Power BI
D365 professionals frequently ask how Fabric relates to tools they may already have heard of or use. The distinctions matter for both budgeting and architecture.
Versus Azure Synapse Analytics
Synapse is a platform-as-a-service (PaaS) offering that requires provisioning and managing resources (SQL pools, Spark pools, integration runtimes) and a separate Azure Data Lake storage account. Fabric delivers comparable capabilities as SaaS on top of OneLake, with far less administration and a per-capacity commercial model. Many Synapse concepts (dedicated SQL, Spark, pipelines) have direct Fabric equivalents, but Fabric removes the infrastructure burden.
Versus standalone Power BI
Power BI is now one workload inside Fabric. If you use Power BI today, you already use part of Fabric. The difference is that Fabric adds the data-storage, engineering, and integration layers beneath Power BI, so the data your reports consume can live in a governed lake rather than in imported model snapshots.
Versus a hand-built Azure data platform
A traditional modern-data-warehouse build stitches together a storage account, Data Factory, Databricks or Synapse Spark, a SQL warehouse, and Power BI — each with its own security, billing, and monitoring. Fabric unifies these under one tenant, one security model, one billing meter, and one governance surface.
The practical takeaway: Fabric is not a wholly new set of skills but a consolidation of existing Microsoft data services into a single, lower-administration product that a capable power user can operate without a dedicated platform team.
3. OneLake: The Foundation
OneLake is the single, tenant-wide data lake that underpins everything in Fabric. The mental model is deliberate: OneLake is to analytics what OneDrive is to documents — one logical store, automatically provisioned for the whole organization, with no infrastructure to set up.
3.1 Why OneLake Matters
- No silos. Every Fabric workload reads and writes the same OneLake. There is exactly one copy of a given table, and every engine sees it.
- Automatic, not provisioned. Unlike a traditional data lake (which requires creating and configuring a storage account), OneLake exists the moment your tenant is enabled.
- Organized by workspace. OneLake is structured into workspaces and then into items (lakehouses, warehouses). This maps cleanly onto the Power BI workspace model users already understand.

3.2 Shortcuts: Reference Data Without Copying It
A defining OneLake feature is the shortcut — a pointer to data that lives elsewhere (in another workspace, in Azure Data Lake Storage, or in Amazon S3) that makes it appear as if it were local, without physically copying it. For D365 scenarios, shortcuts let you surface data already landed by other tools into your own lakehouse, avoiding duplication and keeping a single source of truth.
3.3 Open Storage Format
OneLake stores tabular data as Delta Lake tables backed by Parquet files. Delta adds transactional reliability (ACID), versioning (“time travel”), and schema enforcement on top of the open Parquet columnar format. The practical consequences for a business user: data is compressed and fast to query, it is portable and not locked in, and it can be read by many engines at once.
4. Lakehouse vs. Warehouse: Where Your Data Lands
Fabric offers two primary homes for tabular data. Understanding the difference is the single most useful piece of architectural knowledge for a new Fabric user.
| Dimension | Lakehouse | Warehouse |
| Primary interface | Files and tables; Spark notebooks; SQL analytics endpoint (read-only SQL) | Full T-SQL, read and write |
| Best for | Mixed data (files + tables), raw landing, data engineering, ML | Structured, reporting-ready data managed with SQL |
| Who is comfortable here | Users open to notebooks or point-and-click dataflows | Users and developers fluent in SQL |
| Write mechanism | Dataflows, pipelines, Spark, or shortcuts | T-SQL, dataflows, pipelines |
| Storage | Delta-Parquet in OneLake | Delta-Parquet in OneLake (with transaction logs) |
Both store their data in OneLake as Delta tables, so the choice is about the experience you want, not about where the bytes live. A common beginner pattern is: land D365 data in a lakehouse (flexible, tolerant of change), then serve curated tables from a warehouse or a semantic model for reporting. Many D365 power users never need to leave the lakehouse + Power BI path.
5. Dataflows Gen2: Power Query, promoted
If you have ever cleaned data in Excel’s Get & Transform, or shaped a query when building a Power BI dataset, you have used Power Query. A Fabric Dataflow Gen2 is Power Query running in the cloud, on a schedule, writing its output to a lakehouse or warehouse table that the whole team can use.

Same familiar editor.
The Power Query Online experience — connectors, applied steps, the M language — is identical to what you know.

Reusable and shared.
Instead of each analyst re-cleaning the same export, one dataflow defines the transformation once; everyone consumes the result.

Scheduled refresh.
Dataflows run automatically, so the curated table is always current without manual intervention.

Hundreds of connectors. Including native connectors for Dynamics 365, Dataverse, SQL, SharePoint, web APIs, and files.
Dataflows Gen2 are usually the gentlest on-ramp for a D365 power user because they require no new language or tool — just Power Query skills applied at team scale.
6. Semantic Models and Direct Lake
A semantic model (formerly “Power BI dataset”) is the business layer: the tables, relationships, measures, and definitions that reports are built on. In Fabric this concept is unchanged but gains a powerful new storage mode.
6.1 The Three Query Modes
Import
Data is copied into the model’s memory. Fast queries, but data is a snapshot that must be refreshed, and large models consume memory.
DirectQuery
Queries pass through to the source at run time. Always current, but performance depends on the source.
Direct Lake
A Fabric-only mode that reads Delta-Parquet files directly from OneLake with near-import performance and near-DirectQuery freshness — without importing or duplicating the data.
This is one of Fabric’s most important innovations for BI at scale.
For a D365 power user, Direct Lake means a Power BI report can sit directly on the lakehouse tables fed from Dynamics — fast, current, and with no separate refresh of the report model to manage.
6.2 Direct Lake Framing, Fallback, and When to Prefer Import Mode
Direct Lake introduces two concepts worth understanding before you rely on it in production:
- Framing. The semantic model maintains a “frame” — a consistent view of the underlying Delta tables as of a point in time. When data changes in the lakehouse, the model is re-framed so reports reflect the new data. This is what delivers freshness without a traditional import refresh.
- DirectQuery fallback. If a query exceeds a capacity guardrail (for example, a model too large for the current Fabric SKU, or certain unsupported operations), Direct Lake can automatically fall back to DirectQuery against the SQL endpoint. This preserves correctness but may reduce performance, so it is a signal to review model size or capacity.

When to still prefer Import mode: highly complex models with many calculated columns, sources not in OneLake, or scenarios requiring transformations that Direct Lake does not support. A pragmatic rule for D365 data: start with Direct Lake on well-shaped lakehouse tables; move specific models to Import only if you hit a concrete limitation.
7. Mapping Fabric to What You Already Do
The fastest way to internalize Fabric is to map each new capability onto an existing habit.
| What you do today with D365 data | In Fabric it becomes | What you gain |
| Export D365 entities to Excel repeatedly | Data lands automatically in a lakehouse or warehouse | Always-refreshed, no manual exports |
| Clean and reshape data in Power Query | A Dataflow Gen2, shared across the team | Define once, reuse everywhere |
| Build a Power BI dataset per report | A centralized semantic model (Direct Lake) | One version of the truth, reused |
| Store files in SharePoint and network drives | OneLake as the single analytical store | No silos, governed access |
| Manually join BC, F&O, and CE extracts | All landed in OneLake and modeled together | Repeatable cross-system analysis |
The unifying theme: the same tasks, performed once, in a governed and shared way.
8. Getting Dynamics 365 data into Fabric
There are several supported paths from D365 into OneLake. The right choice depends on which Dynamics product you run — this is the one place where F&O, CE, and Business Central genuinely diverge — and on how much transformation you need.
8.1 Two Ingestion families
Before evaluating individual tools, establish which Dynamics 365 family you are in, because it determines what is even available to you.
Family One
Dataverse-backed apps: Customer Engagement and Finance & Operations
These surface through Microsoft Dataverse, which offers a first-party, no-copy link into OneLake. Ingestion is close to a configuration exercise.
Family Two
Business Central
BC does not run on Dataverse. It has its own tenant database and, in the online service, exposes data through APIs rather than direct database access. Ingestion is a genuine engineering decision with several viable patterns and no first-party equivalent of the Dataverse link.
A frequent and costly assumption is that guidance written for F&O and CE applies unchanged to BC. It does not — at the ingestion layer. It applies completely from the lakehouse onward.
8.2 Link to Microsoft Fabric (Dataverse: CE and F&O)
Dynamics 365 CE and Power Platform data lives in Dataverse. Dataverse offers a native “Link to Microsoft Fabric” capability that surfaces Dataverse tables directly in a Fabric workspace as shortcuts in OneLake — with no ETL to build and no data duplication. Finance & Operations data can be included through Dataverse’s virtual/finance-and-operations tables, and Microsoft’s guidance is explicit that the link covers all Dynamics 365 apps including the Finance and Operations apps. Because the data stays in Dataverse while authorized users work with it in Fabric, this is typically the lowest-effort, most current path.
This path is not available for Business Central. If your source is BC, see Section 8.3 below.
8.3 Business Central: Why it is Different
Business Central is architecturally separate from the Dataverse-backed apps. Three consequences follow, and each one changes a recommendation that holds elsewhere in this paper.
- No Dataverse, therefore no Link to Microsoft Fabric. There is no first-party, zero-ETL shortcut from BC into OneLake. You will need to choose and operate an ingestion mechanism.
- Multi-company, not multi-legal-entity. BC partitions data by company, surfaced in exports as a $Company column. Many BC customers run numerous companies in a single environment, so company must be treated as a first-class dimension from the very first load.

- APIs are the only supported read path online. For Business Central online (Dynamics 365 BC), the supported method for reading data is APIs — either the standard APIs shipped with the product or custom API pages you build in AL and deploy as an extension. Direct reads against the environment database are available only for on-premises installations, and relying on that pattern on-premises can block a later move to the online service.
None of this makes BC a poor fit for Fabric. It simply makes BC ingestion a design decision rather than a checkbox.
8.4 Dynamics 365 BC Ingestion Paths
Four patterns are in common production use. They are not mutually exclusive — most mature implementations combine an initial-load technique with an ongoing-delta technique.
API pages and OData with a Watermark
The native, fully supported approach. Configure API queries to run on read scale-out and filter on the SystemModifiedAt audit field, which is exposed in APIs as lastModifiedDateTime, so each run retrieves only records added or modified since the last successful read. Consume the result with a Dataflow Gen2 or a pipeline. A useful optimization is to first call a lightweight endpoint that reports which tables have new data for each company, then call only those table APIs — this materially reduces call volume on incremental runs.
bc2adls with Fabric Open Mirroring
The de facto community standard. bc2adls (https://github.com/microsoft/bc2adls) is an AppSource extension that exports incremental BC data to Microsoft Fabric or Azure Data Lake Storage. Its Open Mirroring mode writes files into a Fabric landing zone and lets Fabric perform the change-data-capture processing, using a __rowMarker__ column to signal inserts, updates, and deletes. This removes the need for a custom notebook or an intermediate Synapse layer.
Note the governance implication: the original Microsoft repository is read-only and the tool is now maintained as partner-led open source, so it is a supported-by-community rather than supported-by-Microsoft dependency — a point to raise explicitly in any architecture review.
BACPAC Export for the Historical Load
The fastest and least disruptive way to get a full historical load from BC online is a database export as a BACPAC file from the Business Central admin center, restored into Azure SQL Database or SQL Server, from which you bulk-load into OneLake. On-premises installations can simply use a tenant database backup. Use this once for history, then switch to API-based deltas.
Shortcuts Over an Existing ADLS Export
If BC data already lands in an Azure Data Lake account, a OneLake shortcut can surface it without re-engineering ingestion. Be aware of the schema caveat in Section 8.5 below before assuming this works on raw exports.
8.5 The Business Central Column-naming Caveat
This deserves its own warning because it defeats the otherwise excellent shortcut pattern. BC column names carry special characters — $Company, and system fields rendered as names like systemId-2000000000. Parquet files written with those names are not recognized by Fabric Lakehouse shortcuts, which is why teams historically kept a translation or staging layer between the data lake and Fabric. Open Mirroring sidesteps the problem by handling the schema through a metadata definition rather than shortcut inference. If you intend to use plain shortcuts over raw BC exports, plan for a renaming step.

8.6 Dataflows Gen2
When you need to shape, filter, or combine data as it arrives, a Dataflow Gen2 pulls the entities you choose and writes curated tables to your lakehouse. Best when transformation is required or when you want to select a specific subset of entities.
The connector differs by family. For CE and F&O, use the Dynamics 365 / Dataverse connector. For Business Central, use the Dynamics 365 Business Central connector or a generic OData/web connector pointed at your API pages, applying the lastModifiedDateTime filter described in Section 8.4. Dataflows Gen2 are often the most comfortable BC option for a power user, because they keep the entire ingestion in Power Query rather than requiring an AL extension.
8.7 Data pipelines
For orchestration — copying many tables, sequencing steps, handling incremental loads — Data Factory pipelines provide a low-code copy and control-flow experience. Pipelines often call dataflows or notebooks as activities.
8.8 Choosing a Path
Decide by product first, then by transformation need.
| Your situation | CE or F&O | Business Central |
| Least effort, always current | Link to Microsoft Fabric from Dataverse | bc2adls with Open Mirroring |
| Need transformation on the way in | Dataflow Gen2 (Dataverse connector) | Dataflow Gen2 (BC or OData connector) |
| Need orchestration and scale | Pipelines, optionally with notebooks | Pipelines over API pages with watermarks |
| Initial historical load of a large database | Link to Microsoft Fabric from Dataverse | BACPAC export restored to Azure SQL, then bulk load |
| Data already in an ADLS account | OneLake shortcut | OneLake shortcut, subject to the column-naming caveat |
| Prefer no third-party dependency | Link to Microsoft Fabric from Dataverse | API pages plus Dataflow Gen2 or pipelines |
8.9 Incremental Loads, Change Tracking, and Deletes
Bringing a full copy of large D365 tables on every run is slow and costly. Production ingestion should be incremental — moving only rows that changed since the last run. The mechanism depends on the path:
- Link to Microsoft Fabric handles incremental synchronization for you: Dataverse keeps the OneLake copy continuously up to date, including inserts, updates, and deletes, with no pipeline to author.
- Dataflows Gen2 support incremental refresh by defining a date/watermark column and a refresh window, so only recent partitions are reprocessed.
- Pipelines can implement high-watermark patterns using a control table that records the last-loaded timestamp per entity.
- Business Central gives you two purpose-built watermark columns on every table: SystemModifiedAt and SystemRowVersion. Track whichever your tooling prefers — a date or a rowversion — and read changes since that mark. This is also what makes BC pipelines safely rerunnable after a timeout, which matters given the throughput ceiling in Section 8.11.
- A deprecation note for BC teams. Delta links were deprecated in Business Central 2023 release wave 2 and 2024 release wave 1; webhooks are the recommended replacement for change notification. Do not design new BC ingestion around delta links.
Handling deletes is a frequent gap. Hard deletes in D365 will not appear as changes in a naive “append new rows” pattern. Link to Microsoft Fabric propagates deletes automatically; custom pipelines must reconcile deletes explicitly (for example, via soft-delete flags or periodic full compares) to avoid stale rows lingering in the lakehouse.
Deletes are a particular hazard for Business Central, because a watermark-filtered API read cannot see a record that no longer exists. Two workable answers: use bc2adls, which tracks deleted records and — in Open Mirroring mode — signals them to Fabric through the __rowMarker__ value for deletes; or schedule a periodic key-only full compare per company to detect and reconcile removals. Choosing neither means quietly overstated totals that surface months later during a reconciliation.
8.10 Latency, Volume, and the Operational Impact on D365
Two questions consistently arise in architecture reviews:
How fresh is the data?
Link to Microsoft Fabric offers near-real-time synchronization; scheduled dataflows and pipelines are as fresh as their schedule (commonly hourly or daily). For Business Central, Open Mirroring is the freshest practical option — production implementations report latency in the range of ten to fifteen minutes, replacing batch patterns that managed only a handful of refreshes per day. Match the latency to the business need: a monthly financial report does not require minute-level freshness.
Does analytics load the ERP?
A key advantage of landing data in OneLake is that downstream analytics query the lake, not the live D365 database. This isolates heavy reporting workloads from the operational system, protecting transaction performance — a concern with older “report directly against the ERP” approaches.
8.11 Business Central Throughput: A Real Constraint on Scoping
BC readers need a number that F&O and CE readers never have to think about, because it directly bounds what a pilot can promise. API-based extraction from Business Central online has a measurable ceiling.
Per-call Throughput
Measurements show it is not unusual to read approximately 2 MB per second per API call — roughly 120 MB per minute, or about 7,200 MB per hour for pipelines running sequentially.
Parallelism
Business Central online currently permits five parallel API calls. That puts the practical upper bound near 35 GB per hour, and only if nothing else is calling web services on the environment.
Initial Load Duration
At that rate, a 100 GB database can take up to a full day to read. This is a one-time cost, and it is precisely why the BACPAC route exists for history.
Nightly Delta Feasibility
For an ETL setup that refreshes a staging area overnight with the prior day’s changes, this throughput fits most maintenance windows — unless the environment genuinely produces several gigabytes of new or changed data per day.
Three design consequences. Make pipelines rerunnable and timeout-tolerant, using the system watermark fields so a failed run resumes rather than restarts. Select tables and fields deliberately rather than extracting everything, since every column costs throughput. And be careful what you promise: a fifteen-minute-latency operational report over a large BC estate points to Open Mirroring, not to API polling.
9. What Fabric Replaces — and What it Does Not
9.1 What it Can Replace
- Manual, repeated exports of D365 data into Excel workbooks.
- Scattered, divergent copies of the same data across spreadsheets.
- One-off Power BI datasets that each analyst rebuilds independently.
- Fragile links between spreadsheets, network drives, and reports.
- Ad hoc, unrepeatable cross-system joins.
9.2 What It does not replace
Dynamics 365 remains your system of record. Fabric reports on operational data; it does not run operations. You still create orders, post transactions, and manage customers in D365. Fabric is the analytical mirror, not a replacement for the ERP/CRM. This distinction is essential when setting expectations with stakeholders and executives.
10. Use Cases for the D365 Power User
Concrete scenarios where Fabric improves or replaces current workflows:

Consolidated cross-application reporting
Combine F&O financial data and CE sales data in a single Power BI model, eliminating manual reconciliation between systems

Blending D365 with external sources
Join Dynamics 365 data with budgets, third-party CRM extracts, web data, or spreadsheets to produce analysis no single system can

Automated, refreshed datasets
Replace the nightly or weekly Excel export with a lakehouse table that refreshes on a schedule and feeds reports via Direct Lake.

A governed single source of truth
Publish one certified semantic model so every analyst and executive reports on the same numbers and definitions. No Excel data silos!

Multi-company and multi-environment consolidation
A common BC reality is several companies in one environment, or several environments across acquired entities. Landing all of them in one lakehouse with company as a dimension produces a group-level view that BC’s per-company reporting cannot deliver.

Mixed-estate reporting across Dynamics products
Organizations that run BC in subsidiaries and F&O at corporate — a frequent pattern after acquisitions — can report across both once each is landed in OneLake and keys are conformed.

Historical trend and snapshot analysis
Persist daily or period snapshots of D365 data that the operational system itself does not retain (again, without customization), enabling true trend analysis.

Self-service with guardrails
Give analysts access to trusted, classified data while enforcing row-level security so each sees only what they should.
11. Security and Governance Essentials
Even an initial proof-of-concept project should respect a few governance basics, because Fabric data is shared by design.
- Workspaces and roles. Access is granted at the workspace level via roles (Admin, Member, Contributor, Viewer). Assign access to security groups, not individuals, and default users to the least privilege they need.
- Row-level security (RLS). Define RLS on the semantic model so a user in one region or legal entity sees only their rows, from a single shared model.
- Sensitivity labels. Microsoft Information Protection labels applied to D365 data can persist through Fabric and into Power BI exports.

- Environment separation. Keep development, test, and production workspaces separate and promote content through Fabric deployment pipelines.
- Cataloging and lineage. Microsoft Purview integrates with Fabric to catalog assets and trace lineage from the D365 source through to the Power BI report.
For a beginner, the practical minimum is: use groups, default to Viewer, and turn on RLS before sharing broadly.
12. Licensing and Capacity
Fabric is licensed through capacity — a pool of compute measured in Capacity Units (CU) — plus per-user Power BI licensing for content consumption. Understanding the tiers is essential to any project proposal.
| Option | What it is | When to use it |
| Fabric trial | A time-limited free trial capacity | Proof of concept and learning |
| Fabric capacity (F SKUs) | Pay-as-you-go or reserved capacity, F2 through F2048; billed via Azure and pausable | Most production scenarios; start small (e.g., F2/F4/F8) and scale as needed |
| Power BI Premium (P SKUs) | Existing Premium capacity that includes Fabric workloads | Organizations already on Premium |
| Power BI Pro / PPU | Per-user licenses for authoring and sharing Power BI content | Required for consumers depending on capacity tier |
Key points for a proposal:
- Start small. A low F SKU is enough for a pilot; capacity can be scaled up or down and paused to control cost.
- Capacity is shared compute. All workloads (dataflows, warehouse queries, report rendering) draw from the same capacity, so size for peak concurrent demand.
- Pausing saves money. Pay-as-you-go F capacity can be paused when not in use — useful for dev/test.
- Account for the ingestion mechanism’s cost. The Dataverse (F&O / CE) link consumes little Fabric compute because it creates shortcuts rather than copies. BC pipelines and dataflows do consume CU on every run, so a fifteen-minute refresh cadence is a capacity decision, not just a latency one. Open Mirroring shifts CDC processing to the platform and generally costs less than an equivalent pipeline-and-Spark chain.
13. Planning your First Fabric Project
The single most important recommendation for a first project: start small and deliver one measurable win. Avoid a big-bang platform migration.
13.1 Scope
Pick one painful report — ideally one that is currently rebuilt from manual D365 exports. Connect that data, model it once, and publish it. A tightly scoped pilot proves value quickly and builds organizational confidence.

13.2 Prerequisites
- Access to the relevant D365 data and permission to surface it — for CE and F&O, Dataverse access and rights to enable the Fabric link; for Business Central, an account with API permissions (plus an Entra app registration if you use bc2adls).
- A Fabric-enabled workspace on trial or F-SKU capacity.
- A clear owner for the pilot and a named business sponsor.
- Agreement on the one metric that defines success (e.g., “monthly report produced automatically, no manual export”).
13.3 A suggested Step-by-Step
1
Create a workspace and assign it to the capacity
2
Bring the data in*
3
Land the data in a lakehouse; verify tables and refresh
4
Build a semantic model over the lakehouse using Direct Lake
5
Author the report in Power BI; apply RLS if needed
6
Share with the pilot audience via a security group; measure the win
* for CE or F&O, Link to Microsoft Fabric (or a Dataflow Gen2 if transformation is needed); for Business Central, a Dataflow Gen2 over an API page with a watermark filter, or bc2adls with Open Mirroring if near-real-time latency is required
13.4 Common pitfalls
Over-scoping
Trying to model the entire ERP at once instead of one report.

Skipping Governance
Sharing broadly before applying RLS or organizing workspaces.

Under-sizing or Over-sizing Capacity
Start small, monitor the capacity metrics app, and adjust.
Treating Fabric as a Replacement for D365
It is the analytical layer, not the operational system.

Assuming the Dataverse Link Works
The most common planning error in mixed estates. Budget real effort for BC ingestion.

Ignoring the BC API Throughput Ceiling
Committing to a large initial load through APIs alone, without the BACPAC route, turns a one-week pilot into a one-month one.
14. Reference Architecture for a D365 Analytics Pilot
A minimal, defensible first architecture reads left to right:
- Source:
- Dynamics 365 (F&O and/or CE) → Dataverse.
- Ingestion:
- Link to Microsoft Fabric (no-copy) or Dataflow Gen2 (with transformation).
- Open Mirroring via bc2adls (lowest latency), or Dataflow Gen2 / pipelines over API pages with a SystemModifiedAt watermark; BACPAC restore for the one-time historical load.

- Storage: OneLake, organized as a Lakehouse holding Delta tables.
- Modeling: A semantic model in Direct Lake mode over the lakehouse.
- Consumption: Power BI reports and dashboards, secured with RLS and shared via groups.
- Governance (cross-cutting): Microsoft Purview for catalog, lineage, and classification.
This pattern scales: additional sources become new lakehouse tables or shortcuts; additional audiences become new reports over the same governed data model.
15. The Medallion Architecture for D365 Data
As a Fabric implementation matures beyond a single report, a proven pattern for organizing the lakehouse is the medallion architecture — a layered approach that progressively refines raw data into trusted, reporting-ready tables. The layers are conventionally named bronze, silver, and gold.
| Layer | Contents | Typical D365 example | Consumers |
| Bronze (raw) | Data landed as-is from the source, minimal or no transformation | Raw Dataverse / F&O entity tables synchronized into OneLake | Data engineers; reprocessing |
| Silver (cleansed) | De-duplicated, type-corrected, conformed and joined data | Cleaned customer and transaction tables with consistent keys and currencies | Analysts building models |
| Gold (curated) | Business-ready, aggregated, star-schema tables aligned to reporting / security needs | A finance star schema: a sales fact with date, customer, and product dimensions | Power BI semantic models; executives |
For a first project you may collapse these layers, but as you add sources the discipline pays off: bronze preserves an auditable raw copy you can always reprocess; silver centralizes cleansing so it is not repeated; gold gives report authors trustworthy tables shaped for analysis and visualization. Each layer can be a separate lakehouse / warehouse or a set of schemas within one, and dataflows or notebooks promote data from one layer to the next.
16. Data Modeling Best Practices for D365
Landing D365 data is necessary but not sufficient — how you model it determines whether reports are fast, correct, and understandable. The dominant pattern for analytical modeling is the star schema.
16.1 Facts and Dimensions
- Fact tables hold the measurable events — sales order lines, invoice transactions, inventory movements — at a defined grain, with numeric measures and foreign keys.
- Dimension tables hold the descriptive context — customer, product, date, legal entity, salesperson — that you slice and filter by.
D365 operational schemas are highly normalized (many related tables) because that is efficient for transactions. Analytical modeling denormalizes them into a smaller number of wide dimensions and clean facts, which the Power BI engine handles far more efficiently than dozens of normalized joins.
16.2 Practical Guidance for Dynamics Sources

Build a proper date dimension. Do not rely on raw transaction dates; create a dedicated calendar table to support period-over-period analysis, fiscal calendars, and time intelligence.

Conform keys across products. When combining systems, map customer and product identifiers to a single conformed key so the same entity aligns across facts. With three possible sources this becomes a discipline rather than a step — see Section 16.3.

Handle currency and the entity dimension early. Multi-entity D365 deployments carry multiple currencies and organizational units; normalize these in the silver layer so reports do not sum incompatible values. Note the vocabulary differs: F&O uses legal entity, while Business Central uses company, exposed in exports as $Company. Model one conformed organizational dimension and map both into it.

Model slowly changing dimensions where history matters. If a customer’s segment or a product’s category changes over time and you need historical accuracy, implement a slowly changing dimension rather than overwriting the attribute.

Keep measures in the semantic model. Define business calculations (margin, days sales outstanding, backlog) as DAX measures in one certified model, not re-derived in each report.
16.3 Conforming Keys Across F&O, CE, and BC
Combining two Dynamics 365 products is a modeling exercise. Combining three is a governance exercise, as you now hold three unrelated identity schemes for the same real-world customer, product, or vendor.
| Source | Native identity | Partitioning key |
| Customer Engagement | Dataverse GUID primary keys | Business unit / owning team |
| Finance & Operations | Natural entity keys (account, item, customer number) | Legal entity |
| Business Central | SystemId plus the record’s No. code field | Company ($Company) |
A workable approach:
- Build an explicit crosswalk table. Hold one row per real-world entity with its identifier in each source system. Maintain it as data — sourced from a master-data process where one exists — not as DAX or hard-coded logic.
- Create a surrogate key in the silver layer. Assign your own conformed key and carry the source system name plus the native identifier as attributes. Never reuse one system’s key as the conformed key; the first acquisition will break it.
- Define a surviving-record rule. When the same customer exists in BC and F&O with different names, addresses, or terms, decide in advance which source wins per attribute, and record that decision in the catalog / transformation logic.
- Keep the organizational grain unambiguous. Every fact row should carry both the conformed organizational key and its native company or legal entity value, so a discrepancy can always be traced back to the source.
- Do not attempt three-way conforming in the pilot. Land one product, prove the model, then add the second. Conforming is where cross-product projects overrun, and it is entirely avoidable in phase one.
17. Performance and Cost Optimization
Because Fabric bills by capacity, performance and cost are two sides of the same coin: efficient workloads consume fewer Capacity Units (CU) and leave headroom for others.
17.1 How Capacity Consumption Works
- Shared, smoothed compute. Every operation — a dataflow refresh, a warehouse query, a report render — consumes CU from the same capacity. Fabric smooths consumption over time, spreading short bursts so that occasional spikes do not immediately fail.
- Throttling and bursting. If sustained demand exceeds the purchased capacity, Fabric first allows short bursting, then throttles interactive and background operations. Persistent throttling is the signal to optimize workloads or scale the SKU up.
- The Capacity Metrics app. Microsoft provides a monitoring app that shows CU consumption by item and operation. Install it early; it is the primary tool for right-sizing and for identifying expensive dataflows or queries.

17.2 Optimization Techniques
- Prefer incremental over full loads to cut ingestion cost dramatically.
- Let V-Order and table maintenance do their job. Fabric writes optimized, compressed Delta files (V-Order); periodic table maintenance (compaction) keeps queries fast on tables with many small files.
- Right-size semantic models. Remove unused columns and high-cardinality fields the report does not need; they inflate model memory and can trigger Direct Lake fallback.
- Schedule heavy jobs off-peak so background refreshes do not compete with interactive reporting during business hours.
- Pause non-production capacity. Pay-as-you-go dev/test capacity can be paused outside working hours to avoid charges.
18. Operations, Deployment, and Lifecycle Management
A sustainable Fabric practice treats analytics artifacts like software: versioned, promoted through environments, and monitored.
Deployment Pipelines
Fabric deployment pipelines promote content from development to test to production workspaces with deployment rules that repoint data sources per environment, so production never reads from development data.
Git Integration
Workspaces can connect to Azure DevOps or GitHub, storing item definitions in source control. This gives you version history, code review, and the ability to roll back.
Environment Separation
Maintain distinct dev, test, and production workspaces with least-privilege access, and gate promotion with approvals.
Monitoring and Alerting
Beyond the Capacity Metrics app, use refresh-history monitoring and Data Activator to alert owners when a refresh fails or data quality checks breach a threshold.
Documentation and Certification
Endorse trusted semantic models as “certified” so consumers can distinguish authoritative datasets from experiments.
Frequently Asked Questions
Answers to some questions that recur in real engagements.
No. Analytical copies are read from Dataverse/OneLake; reporting queries hit the lake, not the operational database, isolating transaction performance.
Yes for content authoring and, depending on the capacity tier, for consumers. Fabric capacity covers the platform; per-user Power BI licensing still governs report access on smaller SKUs. On Fabric SKUs F64 or above, end users do NOT require Power BI Pro licenses to consume / view data on the platform.
No. OneLake is within your Microsoft tenant; data residency and tenant governance apply as they do for Power BI and Microsoft 365.
Yes — that is a core use case. Both surface through Dataverse/OneLake and can be modeled together once keys are conformed.
No. That capability belongs to Dataverse, and BC does not run on Dataverse. BC reaches OneLake through APIs, dataflows or pipelines, bc2adls with Open Mirroring, or a shortcut over an existing data lake export.
Yes, and it is a common post-acquisition requirement. Land each product in the lakehouse independently, then conform customer, product, and organizational keys in the silver layer as described in Section 16.3. The ingestion differs per product; the modeling and reporting do not.
It is widely used, actively maintained, and available on AppSource, but it is partner-maintained open source rather than a Microsoft-supported feature — the original Microsoft repository is read-only. Treat it as you would any third-party extension: assess the maintenance model, pin versions, and confirm your implementation partner will support it.
Only on-premises. For BC online, APIs are the supported path, and building an integration that depends on direct database access can block a future move to the online service.
Around ten to fifteen minutes with Open Mirroring in production implementations. API-based dataflows and pipelines are as fresh as their schedule and are bound by the throughput ceiling discussed in Section 8.11.
No. Dataflows Gen2 (Power Query) and Power BI cover most business-user needs; notebooks are optional for advanced scenarios.
They continue to work. You can migrate their datasets to Direct Lake over lakehouse tables incrementally, without rebuilding reports from scratch.
20. Migration and Coexistence with Existing Investments
Most organizations do not start from a blank slate. Fabric is designed to coexist with, and gradually absorb, prior data investments.
- Existing exports (BYOD, Export to Data Lake, Synapse Link). If you already export D365 data via older mechanisms, you can often surface that storage into OneLake with shortcuts rather than re-engineering ingestion, then modernize incrementally. Note that some legacy export features are being superseded by Link to Microsoft Fabric; plan migrations accordingly.
- Existing Business Central lake exports. Many BC customers already run bc2adls into an Azure Data Lake account, often with Synapse pipelines and Spark in the chain. Two modernization moves are available: surface the existing lake in OneLake with a shortcut as an interim step, or upgrade BC and bc2adls to versions supporting Open Mirroring and write directly to Fabric. Teams that have made the second move can eliminate the Synapse and Spark layers entirely — going from five moving parts to two — while improving refresh frequency. If you are on the older data integration chain, this is likely the single highest-value change available to you.

- Existing Synapse or Databricks lakes. Because OneLake speaks open Delta-Parque formats and supports shortcuts to ADLS and S3, existing lakes can be referenced in place, avoiding a forced migration.
- Existing Power BI Premium. Premium capacities include Fabric workloads, so many organizations can enable Fabric on capacity they already own before purchasing new F SKUs.
- Phased adoption. A defensible sequence is: (1) surface existing data via shortcuts, (2) build one gold-layer model and report, (3) migrate ingestion to Link/dataflows, (4) consolidate governance in Purview, (5) retire redundant legacy pipelines once the modernized data platform is proven.
The guiding principle is coexistence, not rip-and-replace: prove value on one workload, then expand, decommissioning legacy components only after the Fabric equivalent is trusted in production.
21. Glossary
- Capacity Unit (CU): The unit of compute that Fabric capacity is measured in.
- Capacity Metrics app: A Microsoft-provided app for monitoring CU consumption by item and operation.
- Data Activator: A Fabric capability that triggers actions and alerts when data meets defined conditions.
- Deployment pipeline: A Fabric feature that promotes content across development, test, and production workspaces.
- Dimension: A table of descriptive context (customer, product, date) used to slice and filter facts.
- Fact table: A table of measurable business events at a defined grain, with measures and dimension keys.
- Medallion architecture: A layered lakehouse pattern (bronze/silver/gold) that refines raw data into curated tables.
- Slowly changing dimension (SCD): A modeling technique that preserves historical changes to dimension attributes.
- Star schema: An analytical model of central fact tables surrounded by dimension tables.
- V-Order: Fabric’s write-time optimization that produces compressed, read-optimized Delta-Parquet files.
- Dataflow Gen2: Cloud-hosted Power Query that writes curated tables on a schedule.
- bc2adls: A partner-maintained AppSource extension that exports incremental Business Central data to Microsoft Fabric or Azure Data Lake Storage.
- Dataverse: The data platform underlying Dynamics 365 CE and Power Platform.
- Delta-Parquet: The open, transactional, columnar storage format used by OneLake.
- Direct Lake: A semantic model mode that reads OneLake Delta files directly, combining import-like speed with high freshness.
- F SKU: A Fabric capacity tier (F2–F2048), billed through Azure and pausable.
- Lakehouse: A Fabric item combining files and tables, suited to flexible landing and engineering.
- OneLake: The single, tenant-wide data lake underpinning all Fabric workloads.
- Semantic model: The business layer of tables, relationships, and measures behind reports.
- Shortcut: A pointer that surfaces external data in OneLake without copying it.
- Warehouse: A full T-SQL warehouse item for structured, reporting-ready data.
22. Conclusion and Next Steps
Microsoft Fabric is not a tool reserved for data engineers. Its components map directly onto the work D365 power users already do, and it replaces manual exports and scattered spreadsheets — not Dynamics 365 itself. The one place where your product choice genuinely matters is the first data “hop”: F&O (again, with Power Platform Integration turned on) and CE inherit a no-copy Dataverse link, while Business Central requires a deliberate ingestion design built on APIs, watermarks, and either mirroring or dataflows. From OneLake onward, all three converge on exactly the same platform, patterns, and skills. The pragmatic path forward is to identify one painful report, name an owner, stand up a small capacity, and deliver a single automated, governed dataset end to end. From that first win, the platform scales naturally to more sources, more audiences, and more advanced analytics.
Recommended immediate action: choose your pilot report and its owner this week, and provision a Fabric trial to begin the reference-architecture walkthrough in Section 13.3.
This whitepaper vastly expands on the Community Summit NA 2026 session “Microsoft Fabric for the D365 Power User: From Curious to Confident in 60 Minutes”. Technical details reflect Microsoft Fabric and D365 capabilities as generally available at the time of writing; verify current SKU names, limits, and feature availability against Microsoft documentation before finalizing a procurement or architecture decision.
Related Content



When you’re ready
Let’s hammer it out together.
